Metrics
This section aims to be a comprehensive list of all of the metrics that Finagle exposes. The metrics are organized by layer and then by class.
Note
Some of the metrics are only for clients, some only for servers, and some are for both.
Some metrics are only visible when certain optional classes are used.
Metrics Format
The format that finagle-stats exports metrics in varies based on its type, verbosity level, and scope separator.
Public
These stats come from the public interface, and are the ones that you should look at first to figure out whether a client is abusing you, or you are misusing a downstream service. They are also useful in diagnosing what contributes to request latency.
StatsFilter
- requests
A counter of the total number of successes + failures.
- success
A counter of the total number of successes.
- request_latency_ms
A histogram of the latency of requests in milliseconds.
- pending
A gauge of the current total number of outstanding requests.
- failures/<exception_name>+
A counter of the number of times a specific exception has been thrown. If you are using a
ResponseClassifierthat classifies non-Exceptions as failures, it will use a synthetic Exception,com.twitter.finagle.service.ResponseClassificationSyntheticException, to account for these. See the FAQ for more details.- failures
A counter of the number of times any failure has been observed.
- sourcedfailures/<source_service_name>{/<exception_name>}+
A counter of the number of times a specific SourcedException or sourced Failure has been thrown. Sourced failures include additional information on what service caused the failure.
- sourcedfailures/<source_service_name>
A counter of the number of times any SourcedException or sourced Failure has been thrown from this service. Sourced failures include additional information on what service caused the failure.
- sourcedfailures
A counter of the number of times any SourcedException or sourced Failure has been thrown. Sourced failures include additional information on what service caused the failure.
StatsFactoryWrapper
- failures/<exception_class_name>
A counter of the number of times Service creation has failed with this specific exception.
- failures
A counter of the number of times Service creation has failed.
- service_acquisition_latency_ms
A stat of the latency, in milliseconds, to acquire a service (a session). This entails an amortized cost of materializing a connection for each request, either by establishing new (slow path) or by checking it out from the connection pool (fast path).
In the worst case (establishing a connection on each request), this histogram converges on connect_latency_ms (socket connect latency, including SSL/TLS handshaking). In the best case, this represents a cost of acquiring connection from the pool.
ServerStatsFilter
- handletime_us
A stat of the time it takes to handle the request in microseconds. This is how long it takes to set up the chain of
Futures to be used in the response without waiting for the response. Large values suggest blocking code on a Finagle thread.- transit_latency_ms
A stat that attempts to measure (wall time) transit times between hops, e.g., from client to server. Be aware that clock drift between hosts, stop the world pauses, and queue backups can contribute here. Not supported by all protocols.
RequestSemaphoreFilter
- request_concurrency
A gauge of the total number of current concurrent requests.
- request_queue_size
A gauge of the total number of requests which are waiting because of the limit on simultaneous requests.
PayloadSizeFilter (enabled for Mux, HTTP, Thrift)
- request_payload_bytes verbosity:debug
A histogram of the number of bytes per request’s payload.
- response_payload_bytes verbosity:debug
A histogram of the number of bytes per response’s payload.
Construction
These stats are about setting up services in Finagle, and expose whether you are having trouble making services.
ClientBuilder
- codec_connection_preparation_latency_ms
A histogram of the length of time it takes to prepare a connection and get back a service, regardless of success or failure.
StatsServiceFactory
- available
A gauge of whether the underlying factory is available (1) or not (0). Finagle uses this primarily to decide whether a host is eligible for new connections in the load balancer.
Finagle
These metrics track various Finagle internals.
Tracing
- finagle/tracing/sampled
A counter for the number of times a positive sampling decision is made on an unsampled trace. A sampling decision is made using a client’s configured
Tracer, usingTracer#sampleTrace.
Aperture
- finagle/aperture/coordinate
The process global coordinate for the process as sampled by the Aperture implementation.
- finagle/aperture/peerset_size
A gauge of the size of the services peerset.
FuturePool
These metrics correspond to the state of FuturePool.unboundedPool and
FuturePool.interruptibleUnboundedPool. Only one set of metrics is
exported as they share their underlying “thread pool”.
- finagle/future_pool/pool_size
A gauge of the number of threads in the pool.
- finagle/future_pool/active_tasks
A gauge of the number of tasks actively executing.
- finagle/future_pool/completed_tasks
A gauge of the number of total tasks that have completed execution.
Push Based Abstractions
- finagle/push/unhandled_exceptions
Family of counters for unhandled exceptions caught by the serial executor.
Scheduler
- scheduler/dispatches
A gauge of the number of dispatches performed by the
com.twitter.concurrent.Scheduler.- scheduler/blocking_ms
A gauge of how much time, in milliseconds, the
com.twitter.concurrent.Scheduleris spending doing blocking operations on threads that have opted into tracking. Of the built-inSchedulers, this is only enabled for thecom.twitter.concurrent.LocalSchedulerwhich is the defaultSchedulerimplementation. Note that this does not include time spent doing blocking code outside ofcom.twitter.util.Await.result/Await.ready. For example,Future(someSlowSynchronousIO)would not be accounted for in this metric.
OffloadFilter
These metrics correspond to the state of the offload filter thread pool when configured.
- finagle/offload_pool/pool_size
A gauge of the number of threads in the pool.
- finagle/offload_pool/active_tasks
A gauge of the number of tasks actively executing.
- finagle/offload_pool/completed_tasks
A gauge of the number of total tasks that have completed execution.
- finagle/offload_pool/not_offloaded_tasks
A counter of how many tasks weren’t offloaded because the queue has grown over a proposed limit (set via a flag com.twitter.finagle.offload.queueSize). If a task can’t be offloaded it is run the caller thread which is commonly a Netty IO worker.
- finagle/offload_pool/queue_depth
A Gauge of the number of tasks that are waiting to be executed.
- finagle/offload_pool/pending_tasks
A histogram reporting the number of pending tasks in the offload queue. For efficiency reasons, this stat is sampled each com.twitter.finagle.offload.statsSampleInterval interval. This stat is only enabled if statsSampleInterval is both positive and finite.
- finagle/offload_pool/delay_ms
A histogram reporting offloading delay - how long a task has been sitting in the offload queue before it gets executed. For efficiency reasons, this stat is sampled each com.twitter.finagle.offload.statsSampleInterval interval. This stat is only enabled if statsSampleInterval is both positive and finite.
Timer
- finagle/timer/pending_tasks verbosity:debug
A stat of the number of pending tasks to run for the DefaultTimer.
- finagle/timer/deviation_ms verbosity:debug
A stat of the deviation in milliseconds of tasks scheduled on the DefaultTimer from their expected time.
- finagle/timer/slow
A counter of the number of tasks found to be executing for longer than 2 seconds.
ClientRegistry
- finagle/clientregistry/size
A gauge of the current number of clients registered in the ClientRegistry.
Name Resolution
- inet/dns/queue_size
A gauge of the current number of DNS resolutions waiting for lookup in InetResolver.
- inet/dns/dns_lookups
A counter of the number of DNS lookups attempted by InetResolver.
- inet/dns/dns_lookup_failures
A counter of the number of DNS lookups attempted by InetResolver and failed.
- inet/dns/lookup_ms
A histogram of the latency, in milliseconds, of the time to lookup every host (successfully or not) in a
com.twitter.finagle.Addr.- inet/dns/successes
A counter of the number of
com.twitter.finagle.Addrs with at least one resolved host.- inet/dns/failures
A counter of the number of
com.twitter.finagle.Addrs with no resolved hosts.- inet/dns/cache/size
A gauge of the approximate number of cached DNS resolutions in FixedInetResolver.
- inet/dns/cache/evicts
A gauge of the number of times a cached DNS resolution has been evicted from FixedInetResolver.
- inet/dns/cache/hit_rate
A gauge of the ratio of DNS lookups which were already cached by FixedInetResolver
Netty 4
These metrics are exported from Finagle’s underlying transport implementation, the Netty 4 library and available under finagle/netty4 on any instance running Finagle with Netty 4.
- pending_io_events
A gauge of the number of pending IO events enqueued in all event loops servicing this client or server. If this metric climbs up, it indicates an overload scenario when IO threads are not being able to process the scheduled work (handling new requests and new connections). A very typical cause of these symptoms is either blocking or running a CPU intensive workloads on IO threads.
- worker_threads
A gauge for the size of the Netty worker pool. This will only reflect `EventLoopGroup`s constructed by Finagle and not those manually created by the application.
- pooling/allocations/huge verbosity:debug
A gauge of the total number of HUGE direct allocations (i.e., unpooled allocations that exceed the current chunk size).
- pooling/allocations/normal verbosity:debug
A gauge of the total number of NORMAL direct allocations (i.e., less than a current chunk size).
- pooling/allocations/small verbosity:debug
A gauge of the total number of SMALL direct allocations (i.e., less than a page size, 8192 bytes).
- pooling/allocations/tiny verbosity:debug
A gauge of the total number of TINY direct allocations (i.e., less than 512 bytes).
- pooling/deallocations/huge verbosity:debug
A gauge of the total number of HUGE direct deallocations (i.e., unpooled allocations that exceed the current chunk size).
- pooling/deallocations/normal verbosity:debug
A gauge of the total number of NORMAL direct deallocations (i.e., less than a chunk size).
- pooling/deallocations/small verbosity:debug
A gauge of the total number of SMALL direct deallocations (i.e., less than a page size, 8192 bytes).
- pooling/deallocations/tiny verbosity:debug
A gauge of the total number of TINY direct deallocations (i.e., less than 512 bytes).
- pooling/used* verbosity:debug
A gauge of the number of bytes used for direct allocations (this includes buffers in the thread-local caches).
- reference_leaks
A counter of detected reference leaks. See longer note on com.twitter.finagle.netty4.trackReferenceLeaks for details.
Load Balancing
The client stats under the loadbalancer scope expose the innards of what’s going on with load balancing, and the management of equivalent groups of hosts.
All Balancers
- size
A gauge of the number of nodes being balanced across.
- available
A gauge of the number of available nodes as seen by the load balancer. These nodes are ready to receive traffic.
- busy
A gauge of the number of busy nodes as seen by the load balancer. These nodes are current unavailable for service.
- closed
A gauge of the number of closed nodes as seen by the load balancer. These nodes will never be available for service.
- load
A gauge of the total load over all nodes being balanced across.
- meanweight verbosity:debug
A gauge tracking the arithmetic mean of the weights of the endpoints being load-balanced across.
- num_weight_classes
The number of groups (or classes) of weights in the load balancer. Each class gets a fresh instance of the client’s load balancer and receives traffic proportional to its weight.
- busy_weight_classes
A counter of the number of times a weight class in the loadbalancer was found busy or closed.
- adds
A counter of the number of hosts added to the loadbalancer.
- removes
A counter of the number of hosts removed from the loadbalancer.
- rebuilds
A counter of the number of times the loadbalancer rebuilds its state (triggered by either an underlying namer or failing nodes).
- updates
A counter of the number of times the underlying namer triggers the loadbalancer to rebuild its state (e.g., because the server set has changed). Note that these kind of events are usually collapsed so the actual number of
rebuildsis usually less than the number ofupdates.- panicked
A counter of the number of times a balancer enters panic mode. The estimated portion of unhealthy nodes (status is not Status.Open) in the balancer exceeded the allowable threshold in com.twitter.finagle.loadbalancer.PanicMode. When this occurs, a non-open node may be selected for that request.
- algorithm/{type}
A gauge exported with the name of the algorithm used for load balancing.
Aperture Based Load Balancers
- logical_aperture
A gauge of the width of the window over which endpoints are load-balanced. This is primarily an accounting mechanism and for a true representation of the number of endpoints the client is talking to see physical_aperture.
- physical_aperture
When using deterministic aperture (i.e. useDeterministicOrdering is set), the width of the window over which endpoints are load-balanced may be wider than the logical_aperture gauge. The physical_aperture represents this value.
- use_deterministic_ordering
1 if the Aperture implementation uses deterministic ordering 0, otherwise.
- vector_hash
A gauge of the hash of the distributors serverset vector with range from [Int.MinValue, Int.MaxValue]. It is useful for identifying inconsistencies in the serverset observed by different instances of the same client since inconsistencies will result in very different values of vector_hash. This information is useful for identifying load banding issues when using the deterministic aperture load balancer which requires a consistent view of the backends to operate correctly.
- coordinate_updates
A counter of the number of times the Aperture implementation receives updates from the ProcessCoordinate process global.
- expired
A counter of the number of endpoints which have been closed because they have fallen out of the aperture window and become idle.
Fail Fast
The client stats under the failfast scope give insight into how Finagle handles services where it can’t establish a connection.
FailFastFactory
- marked_dead
A counter of how many times the host has been marked dead due to connection problems.
- marked_available
A counter of how many times the host has been marked available after Finagle reestablished a connection to a dead host.
- unhealthy_for_ms
A gauge of how long, in milliseconds, Finagle has been trying to reestablish a connection.
- unhealthy_num_tries
A gauge of the number of times the Factory has tried to reestablish a connection.
- is_marked_dead
A gauge of whether the host is marked as dead(1) or not(0).
Failure Accrual
The client stats under the failure_accrual scope track how FailureAccrualFactory manages failures.
FailureAccrualFactory
- removed_for_ms
A counter of the total time in milliseconds any host has spent in dead state due to failure accrual.
- probes
A counter of the number of requests sent through failure accrual while a host was marked dead to probe for revival.
- removals
A count of how many times any host has been removed due to failure accrual. Note that there is no specificity on which host in the cluster has been removed, so a high value here could be one problem-child or aggregate problems across all hosts.
- revivals
A count of how many times a previously-removed host has been reactivated after the penalty period has elapsed.
Idle Apoptosis
These client stats keep track of how frequently Services are closed due to prolonged idleness.
ExpiringService
- idle
A counter of the number of times the service has expired from staying idle for too long in between requests.
- lifetime
A counter of the number of times the service has exceeded its lifetime expiration duration.
Rate Limiting
These client stats show how much you’re hitting your rate limit if you’re using rate limiting.
RateLimitingFilter
- refused
A counter of the number of refused connections by the rate limiting filter.
Pooling
These client stats help you keep track of connection churn.
CachingPool
- pool_cached
A gauge of the number of connections cached.
WatermarkPool
- pool_waiters
A gauge of the number of clients waiting on connections.
- pool_size
A gauge of the number of connections that are currently alive, either in use or not.
- pool_num_waited
A counter of the number of times there were no connections immediately available and the client waited for a connection.
- pool_num_too_many_waiters
A counter of the number of times there were no connections immediately available and there were already too many waiters.
SingletonPool
- conn/fail
A counter of the number of times the connection could not be established and must be retried.
- conn/dead
A counter of the number of times the connection succeeded once, but later died and must be retried.
PendingRequestFilter
These stats represent information about the behavior of PendingRequestFilter.
- pending_requests/rejected
A counter of the number of requests that have been rejected by this filter.
Retries
These metrics track the retries of failed requests via the Retries module.
Requeues represent requests that were automatically retried by Finagle. Only failures which are known to be safe are eligible to be requeued. The number of retries allowed are controlled by a dynamic budget, RetryBudget.
For clients built using ClientBuilder, the retries stat represents retries handled by the configured RetryPolicy. Note that application level failures are not included, which is particularly important for protocols that include exceptions, such as Thrift. The number of retries allowed is controlled by the same dynamic budget used for requeues.
Somewhat confusingly for clients created via ClientBuilder there
are an additional set of metrics scoped to tries that come from StatsFilter.
Those metrics represent logical requests, while the metrics below
are for the physical requests, including the retries. You can replicate
this behavior for clients built with the Stack API by wrapping the service
with a StatsFilter scoped to tries.
- retries
A stat of the number of times requests are retried as per a policy defined by the
RetryPolicyfrom aClientBuilder.- retries/requeues
A counter of the number of times requests are requeued. Failed requests which are eligible for requeues are failures which are known to be safe — see
com.twitter.finagle.service.RetryPolicy.RetryableWriteException.- retries/requeues_per_request
A stat of the number of times requests are requeued.
- retries/budget
A gauge of the currently available retry budget.
- retries/budget_exhausted
A counter of the number of times when the budget is exhausted.
- retries/request_limit
A counter of the number of times the limit of retry attempts for a logical request has been reached.
- retries/not_open
A counter of the number of times a request was deemed retryable but was not retried due to the underlying
Servicenot having a status ofOpen.- retries/cannot_retry
A counter of the number of times a request was deemed requeueable but was not requeued due to the underlying
ServiceFactorynot having a status ofOpen.
Backup Requests
These stats provide information on the state and behavior of com.twitter.finagle.client.BackupRequestFilter.
- backups/send_backup_after_ms
A histogram of the time, in milliseconds, after which a request will be re-issued if it has not yet completed.
- backups/backups_sent
A counter of the number of backup requests sent.
- backups/backups_won
A counter of the number of backup requests that completed successfully before the original request.
- backups/budget_exhausted
A counter of the number of times the backup request budget (computed using the current value of the maxExtraLoad param) or client retry budget was exhausted, preventing a backup from being sent.
Dispatching
The client metrics scoped under dispatcher represent information about a client’s dispatching layer.
Depending on the underlying protocol, dispatchers may have different request queueing rules.
- serial/queue_size
A gauge used by serial dispatchers that can only have a single request per connection at a time that represents the number of pending requests.
Server Thread Usage
Metrics scoped under “thread_usage/requests” can be used as a signal for seeing if your connections or threads are imbalanced on a server.
There are caveats which can make these metrics unreliable or not applicable:
Work is done on a
FuturePoolinstead of the server’s thread.The amount of work done per request is highly inconsistent.
Low number of requests.
- relative_stddev
A gauge of the relative standard deviation, or coefficient of variation, for the number of requests handled by each thread. Put another way, the closer this is to 0.0 the less variance there is in the number of requests handled per thread.
If this value is large, before taking action, you may want to first verify the metric by looking at the node’s thread utilization. Examples include mpstat -P ALL and top -p $pid -H. You may also want to look at the debug metrics for “mean” and “stdev” to help quantify the amount of imbalance. One solution to mitigate imbalance is to move work to a
FuturePool.- mean verbosity:debug
A gauge of the arithemetic mean, or average, of the number of requests handled by each thread.
- stddev verbosity:debug
A gauge of the standard of deviation of the number of requests handled by each thread.
- per_thread/<thread_name> verbosity:debug
A counter which indicates the number of requests that a specific thread has received.
Admission Control
The stats under the admission_control scope show stats for the different admission control strategies.
Deadline Admission Control
Note that if the deadline filter is in darkmode (which is the default), these metrics will have the prefix admission_control/darkmode_deadline instead of admission_control/deadline.
- admission_control/deadline/exceeded
A counter of the number of requests whose deadline has expired.
- admission_control/deadline/expired_ms
A stat of the elapsed time since expiry if a deadline has expired, in milliseconds.
- admission_control/deadline/remaining_ms
A stat of the remaining time in a deadline if it has not expired, in milliseconds.
Nack Admission Control
These metrics reflect the behavior of the NackAdmissionFilter.
- dropped_requests
A counter of the number of requests probabilistically dropped.
- nonretryable
A counter of the number of requests that were deemed non-retryable and thus were not passed through the set of nack admission filters.
- ema_value
A gauge of the EMA value. Between 0 and 100, inclusive.
Threshold Failure Detector
The client metrics under the mux/failuredetector scope track the behavior of out-of-band RTT-based failure detection. They only apply to the mux protocol.
ThresholdFailureDetector
- ping
A counter of the number of pings sent to remote peers.
- ping_latency_us verbosity:debug
A stat of round trip ping latencies in microseconds.
- marked_busy
A counter of the number of times the endpoints are marked busy.
- revivals
A counter of the number of times the endpoints revive.
- close
A counter of the number of endpoints that are closed.
Method Builder
Client metrics that are created when using MethodBuilder.
Metrics are scoped to your client’s label and method name.
The logical success and failure stats that are exported by the MethodBuilder are distinguished from the wire stats (clnt/<client_label>/requests) by being per-endpoint, but also by measuring different things. They’re both provided by a StatsFilter, but at completely different layers of the finagle stack, so they measure quite different things. In particular, logical stats represent the actual result you see when using the MethodBuilder client. When you send a request and receive a response, you will always see a single logical request. However, the wire stats represent every time a message was sent over the wire, so it will also include things like retries. Logical requests also include connection attempts, so in the opposite direction, a failed connection attempt won’t be listed under wire requests, but will be seen under logical requests. This is very similar to what was previously captured by the “tries”-scoped StatsFilter when using ClientBuilder.
This image shows what might happen during a single logical request, which has three tries under the hood. In the first try, there was a successful service acquisition (a connection establishment) and then a request which failed. Then there’s another try, which is a failed service acquisition, followed by the last try, where there’s a successful service acquisition, and a successful request:
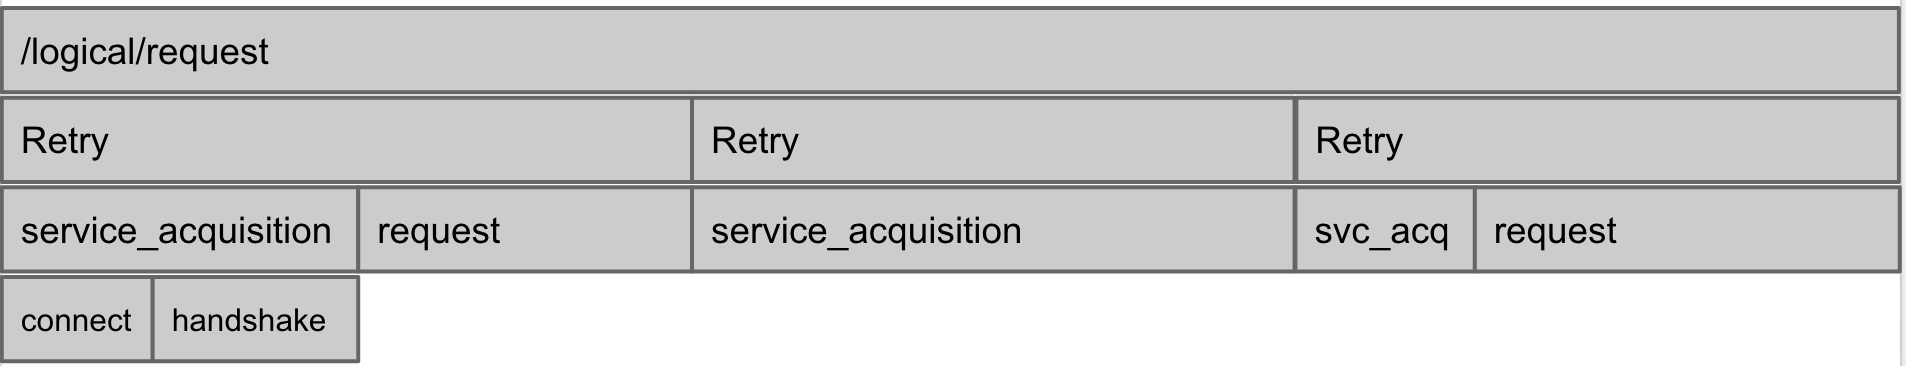
clnt/<client_label>/<method_name>/logical/requests — A counter of the total number of logical successes and failures. This does not include any retries.
clnt/<client_label>/<method_name>/logical/success — A counter of the total number of logical successes.
clnt/<client_label>/<method_name>/logical/failures — A counter of the total number of logical failures.
clnt/<client_label>/<method_name>/logical/failures/<exception_name> — A counter of the number of times a specific exception has caused a logical failure.
clnt/<client_label>/<method_name>/logical/request_latency_ms — A histogram of the latency of the logical requests, in milliseconds.
clnt/<client_label>/<method_name>/retries — A histogram of the number of times requests are retried.
clnt/<client_label>/<method_name>/backups/send_backup_after_ms - A histogram of the time, in milliseconds, after which a request will be re-issued (backup sent) if it has not yet completed. Present only if idempotent is configured.
clnt/<client_label>/<method_name>/backups/backups_sent - A counter of the number of backup requests sent. Present only if idempotent is configured.
clnt/<client_label>/<method_name>/backups/backups_won - A counter of the number of backup requests that completed before the original, regardless of whether they succeeded. Present only if idempotent is configured.
clnt/<client_label>/<method_name>/backups/budget_exhausted - A counter of the number of times the backup request budget (computed using the current value of the maxExtraLoad param) or client retry budget was exhausted, preventing a backup from being sent. Present only if idempotent is configured.
Transport
These metrics pertain to where the Finagle abstraction ends and the bytes are sent over the wire. Understanding these stats often requires deep knowledge of the protocol, or individual transport (e.g. Netty) internals.
Netty Transporter
- connect_latency_ms
A histogram of the length of time it takes for a socket connection (including SSL/TLS handshake) to succeed, in milliseconds.
- failed_connect_latency_ms
A histogram of the length of time it takes for a socket connection (including SSL/TLS handshake) to fail, in milliseconds.
- cancelled_connects
A counter of the number of attempts to connect that were cancelled before they succeeded.
ServerBridge
- read_timeout
A counter of the number of times the netty channel has caught a
ReadTimeoutExceptionwhile reading.- write_timeout
A counter of the number of times the netty channel has caught a
WriteTimeoutExceptionwhile writing.
ChannelRequestStatsHandler
- connection_requests verbosity:debug
A histogram of the number of requests received over the lifetime of a connection.
ChannelStatsHandler
- connects
A counter of the total number of successful connections made.
- closes
A counter of the total number of channel close operations initiated. To see the total number of closes completed, use the total count from one of the “connection_duration”, “connection_received_bytes”, or “connection_sent_bytes” histograms.
- connection_duration verbosity:debug
A histogram of the duration of the lifetime of a connection, in milliseconds.
- connection_received_bytes verbosity:debug
A histogram of the number of bytes received over the lifetime of a connection.
- connection_sent_bytes verbosity:debug
A histogram of the number of bytes sent over the lifetime of a connection.
- received_bytes
A counter of the total number of received bytes.
- sent_bytes
A counter of the total number of sent bytes.
- tcp_retransmits verbosity:debug
A counter of the number of TCP retransmits that have occurred.
- tcp_send_window_size verbosity:debug
A histogram of the TCP send window size (in bytes) per channel.
- writableDuration verbosity:debug
A gauge of the length of time the socket has been writable in the channel.
- unwritableDuration verbosity:debug
A gauge of the length of time the socket has been unwritable in the channel.
- connections
A gauge of the total number of connections that are currently open in the channel.
- exn/<exception_name>+
A counter of the number of times a specific exception has been thrown within a Netty pipeline.
- tls/connections
A gauge of the total number of SSL/TLS connections that are currently open in the channel.
- tls/snooped_connects
A counter of the number of TLS connections that were detected via snooping.
IdleChannelHandler
- disconnects/{READER_IDLE,WRITER_IDLE}
A counter of the number of times a connection was disconnected because of a given idle state.
SSL/TLS
- handshake_latency_ms
A histogram of the SSL/TLS handshake latency in milliseconds.
- failed_handshake_latency_ms verbosity:debug
A histogram of the failed SSL/TLS handshake latency in milliseconds.
Service Discovery
These metrics track the state of name resolution and service discovery.
Name Resolution
Finagle clients resolve names into sets of network addresses to which sockets can be opened. A number of the moving parts involved in this process are cached (i.e. Dtabs, Names, and NameTrees). The following stats are recorded under the namer/{dtabcache,namecache,nametreecache} scopes to provide visibility into this caching.
- misses
A counter of the number of cache misses.
- evicts
A counter of the number of cache evictions.
- expires
A counter of the number of idle
ServiceFactorys that were actively evicted.- idle
A gauge of the number of cached idle
ServiceFactorys.- oneshots
A counter of the number of “one-off”
ServiceFactorys that are created in the event that no idleServiceFactorys are cached.- namer/bind_latency_us
A stat of the total time spent resolving
Names.
Initial Resolution
finagle/clientregistry/initialresolution_ms
A counter of the time spent waiting for client resolution via ClientRegistry.expAllRegisteredClientsResolved.
Address Stabilization
Resolved addresses (represented as an instance of Addr) are stabilized in two ways:
ZooKeeper failures will not cause a previously bound address to fail.
When a member leaves a cluster, its removal is delayed.
Note that hosts added to a cluster are reflected immediately.
The following metrics are scoped under the concatenation of zk2/ and the ServerSet’s ZooKeeper path.
- limbo
A gauge tracking the number of endpoints that are in “limbo”. When a member leaves a cluster, it is placed in limbo. Hosts in limbo are still presented to the load balancer as belonging to the cluster, but are staged for removal. They are removed if they do not recover within an interval bound by the ZooKeeper session timeout.
- size
A gauge tracking the total size of the live cluster, not including members in limbo.
- zkHealth
A gauge tracking the health of the underlying zk client as seen by the resolver. Unknown(0), Healthy(1), Unhealthy(2), Probation(3)
- observed_serversets
A gauge tracking the number of clusters whose membership status is currently been tracked within the process. This metric differs from session_cache_size below in that it tracks live clusters rather than the total number of cached sessions.
ZooKeeper Diagnostics
The following stats reflect diagnostic information about the ZooKeeper sessions opened for the purposes of service discovery.
Under the `zk2` scope
- session_cache_size
A gauge tracking the number of distinct logical clusters whose membership status has been tracked within the process.
- entries/read_ms
A histogram of the latency, in milliseconds, of reading entry znodes.
- entries/parse_ms
A histogram of the latency, in milliseconds, of parsing the data within entry znodes.
- vectors/read_ms
A histogram of the latency, in milliseconds, of reading vector znodes.
- vectors/parse_ms
A histogram of the latency, in milliseconds, of parsing the data within vector znodes.
Under the `zkclient` scope
- ephemeral_successes
A counter of the number successful ephemeral node creations.
- ephemeral_failures
A counter of the number failed ephemeral node creations.
- ephemeral_latency_ms
A histogram of the latency, in milliseconds, of ephemeral node creation.
- watch_successes
A counter of the number successful watch-related operations (i.e. “watch exists”, “get watch data”, and “get child watches” operations).
- watch_failures
A counter of the number failed watch-related operations.
- watch_latency_ms
A histogram of the latency, in milliseconds, of watch-related operations.
- read_successes
A counter of the number successful ZooKeeper reads.
- read_failures
A counter of the number failed ZooKeeper reads.
- read_latency_ms
A histogram of the latency, in milliseconds, of ZooKeeper reads.
- write_successes
A counter of the number successful ZooKeeper writes.
- write_failures
A counter of the number failed ZooKeeper writes.
- write_latency_ms
A histogram of the latency, in milliseconds, of ZooKeeper writes.
- multi_successes
A counter of the number successful transactional operations.
- multi_failures
A counter of the number failed transactional operations.
- multi_latency_ms
A histogram of the latency, in milliseconds, of transactional operations.
- session_sync_connected
A counter of the number of read-write session transitions.
- session_connected_read_only
A counter of the number of read-only session transitions.
- session_no_sync_connected
Unused (should always be 0).
- session_sasl_authenticated
A counter of the number of sessions upgraded to SASL.
- session_auth_failed
A counter of the number of session authentication failures.
- session_disconnected
A counter of the number of temporary session disconnects.
- session_expired
A counter of the number of session expirations.
- session_closed
A counter of the number of closed sessions.
JVM
A wide variety of metrics are exported which provide insight into the JVM’s runtime. These include garbage collection, allocations, threads, uptime, and more.
If you are using a Hotspot VM, additional metrics are exported that may be useful. This includes safe point time (jvm/safepoint), metaspace usage (jvm/mem/metaspace), allocation rates (jvm/mem/allocations), time running application code since start (jvm/application_time_millis), and tenuring threshold (jvm/tenuring_threshold).
- jvm/mem/allocations/eden/bytes
A gauge of the number of bytes allocated into the eden. This is a particularly relevant metric for service developers. The vast majority of allocations are done into the eden space, so this metric can be used to calculate the allocations per request which in turn can be used to validate code changes don’t increase garbage collection pressure on the hot path.
- jvm/gc/msec
A gauge of the total elapsed time doing collections, in milliseconds.
- jvm/gc/cycles
A gauge of the number of the total number of collections that have occurred.
- jvm/gc/eden/pause_msec
A stat of the durations, in millseconds, of the eden collection pauses.
- jvm/gc/{gc_pool_name}/msec
A gauge for the named gc pool of the total elapsed time garbage collection pool doing collections, in milliseconds. Names are subject to change.
- jvm/gc/{gc_pool_name}/cycles
A gauge for the named gc pool of the total number of collections that have occurred. Names are subject to change.
- jvm/thread/count
A gauge of the number of live threads including both daemon and non-daemon threads.
- jvm/thread/daemon_count
A gauge of the number of live daemon threads.
- jvm/thread/peak_count
A gauge of the peak live thread count since the Java virtual machine started or peak was reset.
- jvm/uptime
A gauge of the uptime of the Java virtual machine in milliseconds.
- jvm/spec_version
A gauge of the running Java virtual machine’s specification version. Generally maps to the VM’s major version.
- jvm/start_time
A gauge of the start time of the Java virtual machine in milliseconds since the epoch.
- jvm/application_time_millis
A gauge of the total time running application code since the process started in milliseconds.
- jvm/tenuring_threshold
A gauge of the number of times an object must survive GC in order to be promoted or 0 if the metric is unavailable.
- jvm/num_cpus
A gauge of the number of processors available to the JVM.
- jvm/fd_limit
(only available on Unix-based OS) A gauge of the maximum number of file descriptors.
- jvm/fd_count
(only available on Unix-based OS) A gauge of the number of open file descriptors.
- jvm/compilation/time_msec
A gauge of the elapsed time, in milliseconds, spent in compilation.
- jvm/classes/current_loaded
A gauge of the number of classes that are currently loaded.
- jvm/classes/total_loaded
A gauge of total number of classes that have been loaded since the JVM started.
- jvm/classes/total_unloaded
A gauge of total number of classes that have been unloaded since the JVM started.
- jvm/safepoint/count
A gauge of the number of safepoints taken place since the JVM started.
- jvm/safepoint/sync_time_millis
A gauge of the cumulative time, in milliseconds, spent getting all threads to safepoint states.
- jvm/safepoint/total_time_millis
A gauge of the cumulative time, in milliseconds, that the application has been stopped for safepoint operations.
- jvm/mem/metaspace/max_capacity
A gauge of the maximum size, in bytes, that the metaspace can grow to.
- jvm/heap/used
For the heap used for object allocation, a gauge of the current amount of memory used, in bytes.
- jvm/heap/committed
For the heap used for object allocation, a gauge of the amount of memory, in bytes, committed for the JVM to use.
- jvm/heap/max
For the heap used for object allocation, a gauge of the maximum amount of memory, in bytes, that can be used by the JVM.
- jvm/nonheap/used
For the non-heap memory, a gauge of the current amount of memory used, in bytes.
- jvm/nonheap/committed
For the non-heap memory, a gauge of the amount of memory, in bytes, committed for the JVM to use.
- jvm/nonheap/max
For the non-heap memory, a gauge of the maximum amount of memory, in bytes, that can be used by the JVM.
- jvm/mem/current/used
A gauge of the of the current memory used, in bytes, across all memory pools.
- jvm/mem/current/{memory_pool_name}/used
A gauge of the of the current memory used, in bytes, for the named memory pools.
- jvm/mem/current/{memory_pool_name}/max
A gauge of the of the maximum memory that can be used, in bytes, for the named memory pool.
- jvm/mem/postGC/used
A gauge of the memory used, in bytes, across all memory pools after the most recent garbage collection.
- jvm/mem/postGC/{memory_pool_name}/used
A gauge of the memory used, in bytes, for the named memory pool after the most recent garbage collection.
- jvm/mem/buffer/{buffer_pool_name}/count
A gauge of the number of buffers in the named pool. Example pool names include direct and mapped, though the names are subject to change.
- jvm/mem/buffer/{buffer_pool_name}/used
A gauge of the amount of memory used, in bytes, for the named pool. Example pool names include direct and mapped, though the names are subject to change.
- jvm/mem/buffer/{buffer_pool_name}/max
A gauge of the amount of memory capacity, in bytes, for the named pool. Example pool names include direct and mapped, though the names are subject to change.
Toggles
These metrics correspond to feature toggles.
- toggles/<libraryName>/checksum
A gauge summarizing the current state of a ToggleMap which may be useful for comparing state across a cluster or over time.
Streaming
All streaming metrics are automatically collected by Finagle by setting isChunked as true on Http request or response. All metrics are traced using the binary annotations with a clnt/<clnt_name>/ prefix on the client side, and srv/ prefix on the server side.
The following metrics are added by StreamingStatsFilter
- http/stream/request/closed
A counter of the number of closed request streams.
- http/stream/request/duration_ms
A histogram of the duration of the lifetime of request streams, from the time a stream is initialized until it’s closed, in milliseconds.
- http/stream/request/failures
A counter of the number of times any failure has been observed in the middle of a request stream.
- http/stream/request/failures/<exception_name>
A counter of the number of times a specific exception has been thrown in the middle of a request stream.
- http/stream/request/opened
A counter of the number of opened request streams.
- http/stream/request/pending
A gauge of the number of pending request streams.
- http/stream/response/closed
A counter of the number of closed response streams.
- http/stream/response/duration_ms
A histogram of the duration of the lifetime of response streams, from the time a stream is initialized until it’s closed, in milliseconds.
- http/stream/response/failures
A counter of the number of times any failure has been observed in the middle of a response stream.
- http/stream/response/failures/<exception_name>
A counter of the number of times a specific exception has been thrown in the middle of a response stream.
- http/stream/response/opened
A counter of the number of opened response streams.
- http/stream/response/pending
A gauge of the number of pending response streams.
- stream/request/chunk_payload_bytes verbosity:debug
A histogram of the number of bytes per chunk’s payload of request streams. This is measured in c.t.finagle.http.filter.PayloadSizeFilter
- stream/response/chunk_payload_bytes verbosity:debug
A histogram of the number of bytes per chunk’s payload of response streams. This is measured in c.t.finagle.http.filter.PayloadSizeFilter
- You could derive the streaming success rate of:
the total number of streams number of successful streams divided by number of total streams
closed streams number of successful streams divided by number of closed streams
Here we assume a success stream as a stream terminated without an exception or a stream that has not terminated yet.
Take request stream as an example, assuming your counters are not “latched”, which means that their values are monotonically increasing:
# Success rate of total number of streams: 1 - (rated_counter(stream/request/failures)
/ (gauge(stream/request/pending) + rated_counter(stream/request/closed)))
# Success rate of number of closed streams: 1 - (rated_counter(stream/request/failures) / rated_counter(stream/request/closed))
HTTP
These stats pertain to the HTTP protocol.
- nacks
A counter of the number of retryable HTTP 503 responses the Http server returns. Those responses are automatically retried by Finagle HTTP client.
- nonretryable_nacks
A counter of the number of non-retryable HTTP 503 responses the HTTP server returns. Those responses are not automatically retried.
- Deprecated: stream/failures/<exception_name>
The replacement is stream/request/failures/<exception_name> and stream/response/failures/<exception_name>. A counter of the number of times a specific exception has been thrown in the middle of a stream.
- Deprecated: stream/failures
The replacement is stream/request/failures and stream/response/failures. A counter of the number of times any failure has been observed in the middle of a stream.
- http/cookie/samesite_failures verbosity:debug
A counter of the number of failed attempts to decode the SameSite Cookie attribute.
- rejected_invalid_header_names
A counter of the number of rejected requests by a server due to an invalid (as seen by RFC-7230) header name.
- rejected_invalid_header_values
A counter of the number of rejected requests by a server due to an invalid (as seen by RFC-7230) header value.
These metrics are added by StatsFilter and can be enabled by using .withHttpStats on Http.Client and Http.Server.
- status/<statusCode>
A counter of the number of responses received, or returned for servers, that had this statusCode.
- status/<statusClass>
Same as status/statusCode but aggregated per category, e.g. all 500 range responses count as 5XX for this counter.
- time/<statusCode>
A histogram on duration in milliseconds per HTTP status code.
- time/<statusCategory>
A histogram on duration in milliseconds per HTTP status code category.
HTTP2
These stats pertain to HTTP2 only.
- <server_label>/upgrade/success
A counter of http2 upgrades and new prior knowledge connections server side.
- <client_label>/upgrade/success
A counter of http2 upgrades and new prior knowledge connections client side.
- <server_label>/upgrade/ignored
A counter of http2 upgrades that were ignored due to an unsuitable request.
- <client_label>/upgrade/ignored
A counter of http2 upgrades that were ignored due to an unsuitable request.
- <client_label>/upgrade/attempt
A counter of http2 upgrade attempts made by the client.
- <server_label>/streams
A gauge exposing the number of opened streams on the server.
- <client_label>/streams
A gauge exposing the number of opened streams on the client.
- <client_label>/buffered_streams
A gauge exposing the number of buffered streams on the client.
- <client_label>/dead_session
A counter of the number of closed sessions evicted.
- <client_label>/dead_child_transport
A counter of the number of child transports that were returned in a dead state.
- <client_label>closed_before_upgrade
A counter of the number of h2c upgrade transports that were closed before the upgrade had completed.
Memcached
These stats pertain to the Memcached protocol.
- <label>/redistributes
A counter of the number of times the cache ring has been rebuilt. This occurs whenever a node has been ejected or revived, or the set of nodes changes.
- <label>/joins
A counter of the number of times a node has been added to the cache ring because the backing set of servers has changed.
- <label/leaves>
A counter of the number of times a node has been removed from the cache ring because the backing set of servers has changed.
- <label>/ejections
A counter of the number of times a node has been ejected from the cache ring.
- <label>/revivals
A counter of the number of times an ejected node has been re-added to the cache ring.
Mux
These stats pertain to the Mux protocol.
- <server_label>/mux/draining
A counter of the number of times the server has initiated session draining.
- <server_label>/mux/leased verbosity:debug
A counter of the number of leases issued by the server when the session is is in a state other than draining or drained.
- <client_label>/mux/draining
A counter of the number of times a server initiated session draining.
- <client_label>/mux/drained
A counter of the number of times server-initiated draining completed successfully.
- <server_label>/mux/duplicate_tag
A counter of the number of requests with a tag while a server is processing another request with the same tag.
- <server_label>/mux/orphaned_tdiscard
A counter of the number of Tdiscard messages for which the server does not have a corresponding request. This happens when a server has already responded to the request when it receives a Tdiscard.
- clienthangup
A counter of the number of times sessions have been abruptly terminated by the client.
- serverhangup
A counter of the number of times sessions have been abruptly terminated by the server.
- <label>/mux/framer/write_stream_bytes
A histogram of the number of bytes written to the transport when mux framing is enabled.
- <label>/mux/framer/read_stream_bytes
A histogram of the number of bytes read from the transport when mux framing is enabled.
- <label>/mux/framer/pending_write_streams
A gauge of the number of outstanding write streams when mux framing is enabled.
- <label>/mux/framer/pending_read_streams
A gauge of the number of outstanding read streams when mux framing is enabled.
- <label>/mux/framer/write_window_bytes
A gauge indicating the maximum size of fragments when mux framing is enabled. A value of -1 means that writes are not fragmented.
- <label>/mux/transport/read/failures/
A counter indicating any exceptions that occur on the transport read path for mux. This includes exceptions in handshaking, thrift downgrading (for servers), etc.
- <label>/mux/transport/write/failures/
A counter indicating any exceptions that occur on the transport write path for mux. This includes exceptions in handshaking, thrift downgrading (for servers), etc.
- <label>/mux/tls/upgrade/success
A counter of the number of times the client or server has successfully upgraded a connection to TLS.
- <label>/mux/tls/upgrade/incompatible
A counter of the number of times a client or server failed to establish a session due to incompatible TLS requirements or capabilities.
<label>/mux/handshake_latency_us verbosity:debug
A histogram of the mux handshake latency.
Mysql
These stats pertain to the finagle-mysql implementation.
- <label>/rollback_latency_ms
The latency of the automatic rollback issued when a connection is put back into the pool.
- <label>/cursor/time_per_stream_ms
The latency from start to finish of a cursor stream.
- <label>/cursor/time_per_fetch_ms
The latency of individual cursor fetches.
- <label>/cursor/time_between_fetch_ms
The latency between individual cursor fetches.
- <label>/cursor/opened
A counter of the number of opened cursors.
- <label>/cursor/closed
A counter of the number of closed cursors.
- <label>/pstmt-cache/calls
A counter of the number of requested prepared statements.
- <label>/pstmt-cache/misses
A counter of the number of times when a prepared statement was not the cache.
- <label>/pstmt-cache/evicted_size
A counter of the number of times prepared statements were evicted from the cache.
ThriftMux
These stats pertain to the ThriftMux protocol.
- <server_label>/thriftmux/connects
A counter of the number of times the server has created a ThriftMux connection. This does not include downgraded Thrift connections.
- <server_label>/thriftmux/downgraded_connects
A counter of the number of times the server has created a downgraded connection for “plain” Thrift.
PerEndpoint StatsFilter
Thrift/ThriftMux server side per-endpoint stats can be enabled by .withPerEndpointStats, such as ThriftMux.server.withPerEndpointStats…
- <server_label>/<service_name>/<method_name>/requests
A counter of the total number of successes + failures for <method_name>.
- <server_label>/<service_name>/<method_name>/success
A counter of the total number of successes for <method_name>.
- <server_label>/<service_name>/<method_name>/failures/<exception_name>+
A counter of the number of times a specific exception has been thrown for <method_name>.
- <server_label>/<service_name>/<method_name>/failures
A counter of the number of times any failure has been observed for <method_name>.
Thrift/ThriftMux client side per-endpoint stats need to be enabled by .withPerEndpointStats when constructing a client ServicePerEndpoint. Similar metrics as server side:
<client_label>/<service_name>/<method_name>/requests
<client_label>/<service_name>/<method_name>/success
<client_label>/<service_name>/<method_name>/failures/<exception_name>+
<client_label>/<service_name>/<method_name>/failures
Partitioning
See here for how to enable ThriftMux Partition Aware Client.
Partitioning metrics are under clnt/<server_label>/partitioner/ scope given insights into how client stack manages partition nodes.
HashingPartitioningStrategy
- redistributes
A counter of the times the nodes on the hash ring have been redistributed.
- joins
A counter of the times a new node joins the hash ring, indicating a new partition joins the cluster.
- leaves
A counter of the times a node leaves the hash ring, indicating service discovery detects a node leave.
- ejections
A counter of the times an unhealthy node marked by ConsistentHashingFailureAccrual has been removed from the hash ring. leaves and joins indicate service discovery updates, while ejections and revivals indicate the code health status.
- revivals
A counter of the times an ejected node has been marked as live on the hash ring. leaves and joins indicate service discovery updates, while ejections and revivals indicate node health status.
- live_nodes
A gauge of the current total number of healthy partitions.
- dead_nodes
A gauge of the current total number of unhealthy partitions marked by ConsistentHashingFailureAccrual.
CustomPartitioningStrategy (ThriftMux)
- nodes
A gauge of the current total number of logical partitions.