HTTP Admin interface
TwitterServer starts an HTTP server and includes a variety of tools for diagnostics, profiling, and more. It binds to the port defined by the flag -admin.port and uses port 9990 by default.
Visit /admin on your service’s admin port in a web browser to see what is available.
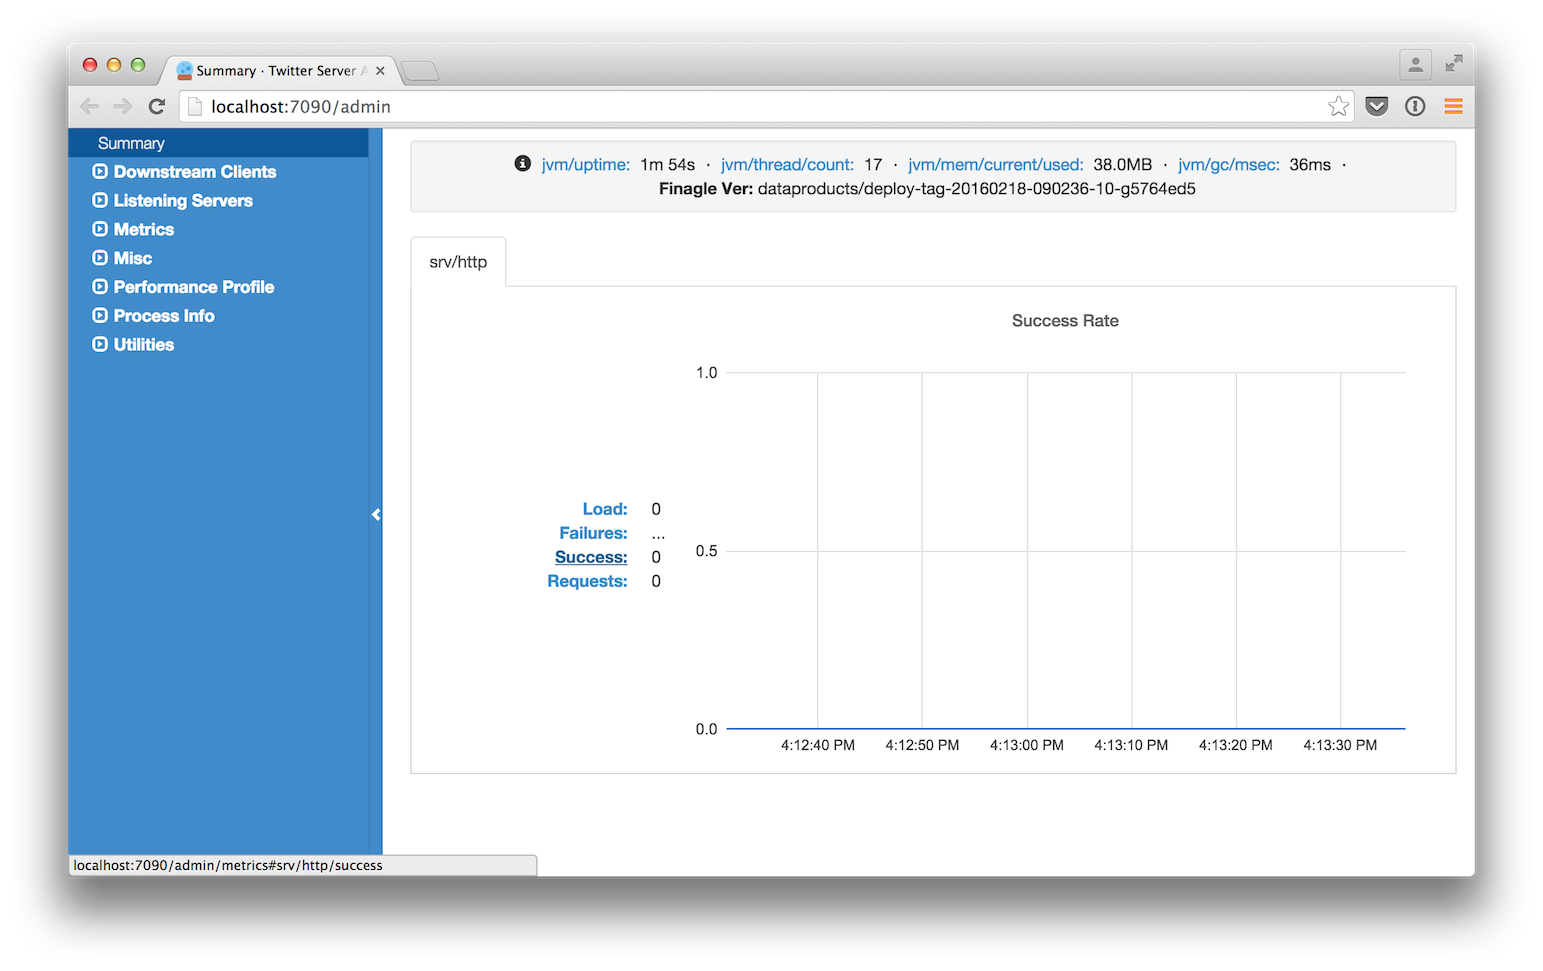
TwitterServer defines a series of default endpoints grouped into a variety of categories.
Process Info
Endpoints that provide insights into your service’s configuration and usage.
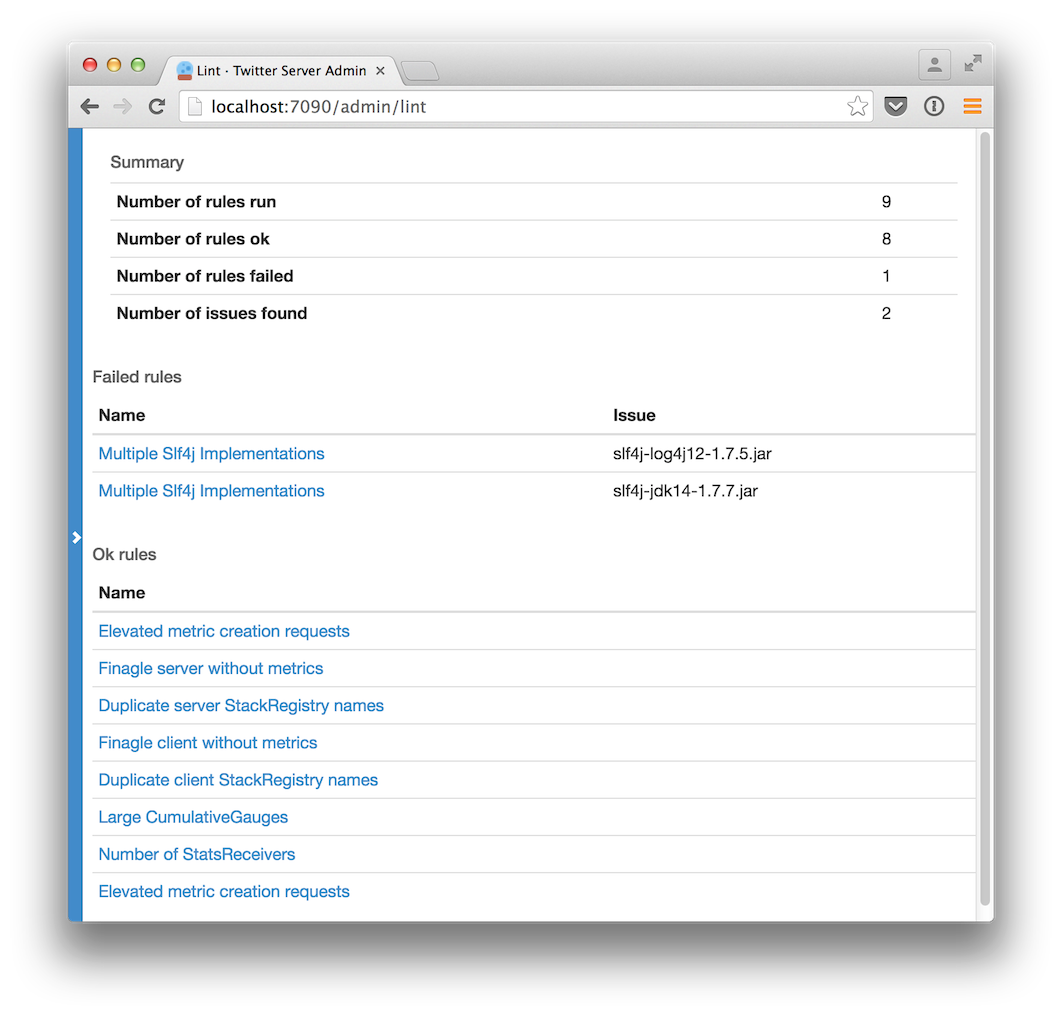
/admin/lint
Runs and displays the results for all registered linters to check for various service issues. This can help you identify misuse or abuse of functionality.
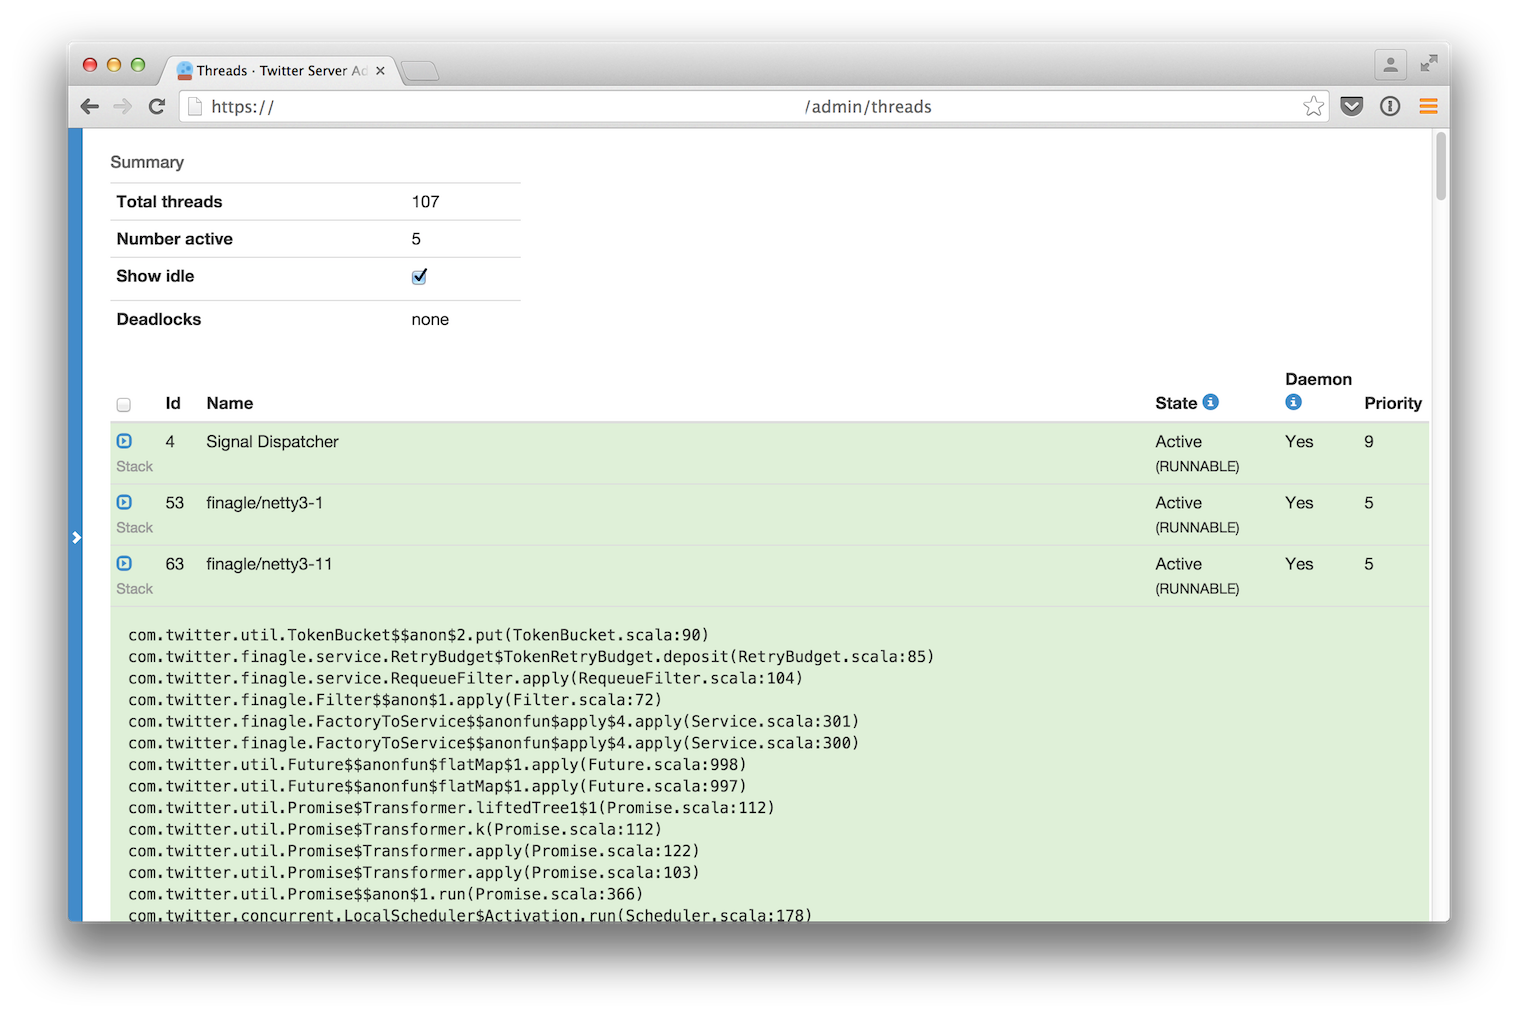
/admin/threads
A user interface for capturing the current stacktraces. Includes filtering of inactive threads as well as deadlock detection. JSON output is also available through tools like curl via the inspection of the HTTP Accept header.
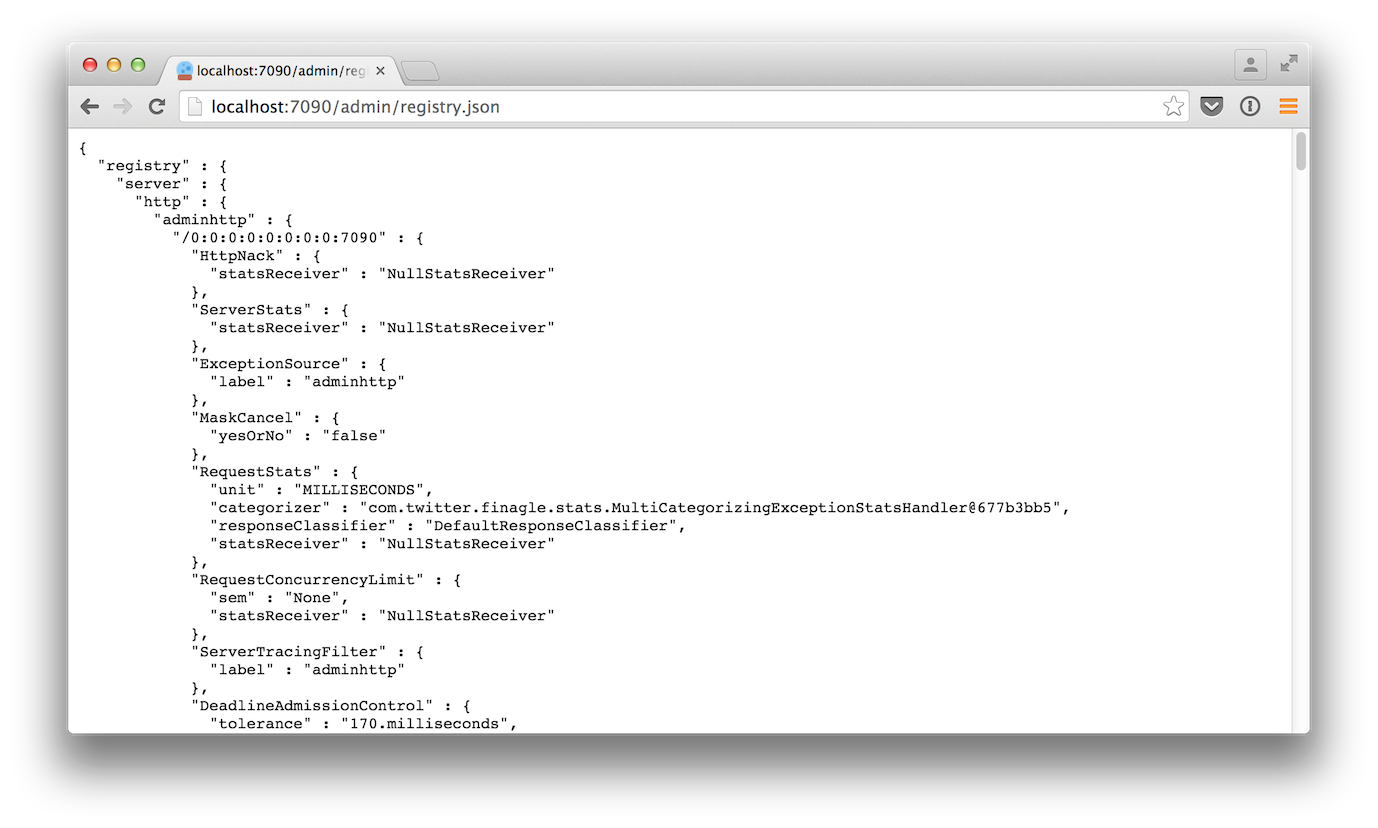
/admin/registry.json
Displays how the service is currently configured across a variety of dimensions including the client stack, server stack, flags, service loader values, system properties, environment variables, build properties and more.
The HTTP request parameter filter allows for simple filtering of the returned data. The value takes the form “path/to/data” and returns registry entries whose prefix matches the parameter. A glob, *, can be used to match any component of the path. For example, using “filter=registry/server/http” will output all Finagle Http servers. Using “filter=registry/client/*/user_service” would output all Finagle clients with a label of “user_service” regardless of protocol.
Due to the usage of / as a delimiter, it means you cannot match components containing a /. The choice of * as a glob also means you cannot match registry components with the exact value of *. For these use cases, there is the more powerful jq command-line JSON processing tool.
/admin/balancers.json
Shows details about client load balancers, including both configuration and current status.
The HTTP request parameter label allows for filtering down to a client whose label matches that.
Example JSON output:
{
  "clients" : [
    {
      "label" : "cool_service",
      "info" : {
        "balancer_class" : "P2CLeastLoaded",
        "size" : 1,
        "total_pending" : 0,
        "number_available" : 1,
        "number_busy" : 0,
        "additional_info" : { },
        "status" : "Open",
        "number_closed" : 0,
        "total_load" : 0.0
      }
    }
  ]
}
/admin/server_info
Return build information about this server. See /admin/registry.json for this in addition to other details.
{
  "name" : "myserver",
  "version" : "1.0.0-SNAPSHOT",
  "build" : "20130221-105425",
  "build_revision" : "694299d640d337c58fadf668e44322b17fd0562e",
  "build_branch_name" : "refs/heads/twitter-server!doc",
  "build_last_few_commits" : [
    "694299d (HEAD, origin/twitter-server!doc, twitter-server!doc) Merge branch 'master' into twitter-server!doc",
    "ba1c062 Fix test for sbt + Jeff's comments",
  ],
  "start_time" : "Thu Feb 21 13:43:32 PST 2013",
  "uptime" : 22458
}
/admin/announcer
Returns a set of announcement chains that have run through the Announcer. This allows one to see how a particular target is being announced.
Utilities
Endpoints that cover various utilities that developers can manipulate at runtime.
/admin/tracing
Enable (/admin/tracing?enable=true) or disable tracing (/admin/tracing?disable=true)
See zipkin documentation for more info regarding tracing.
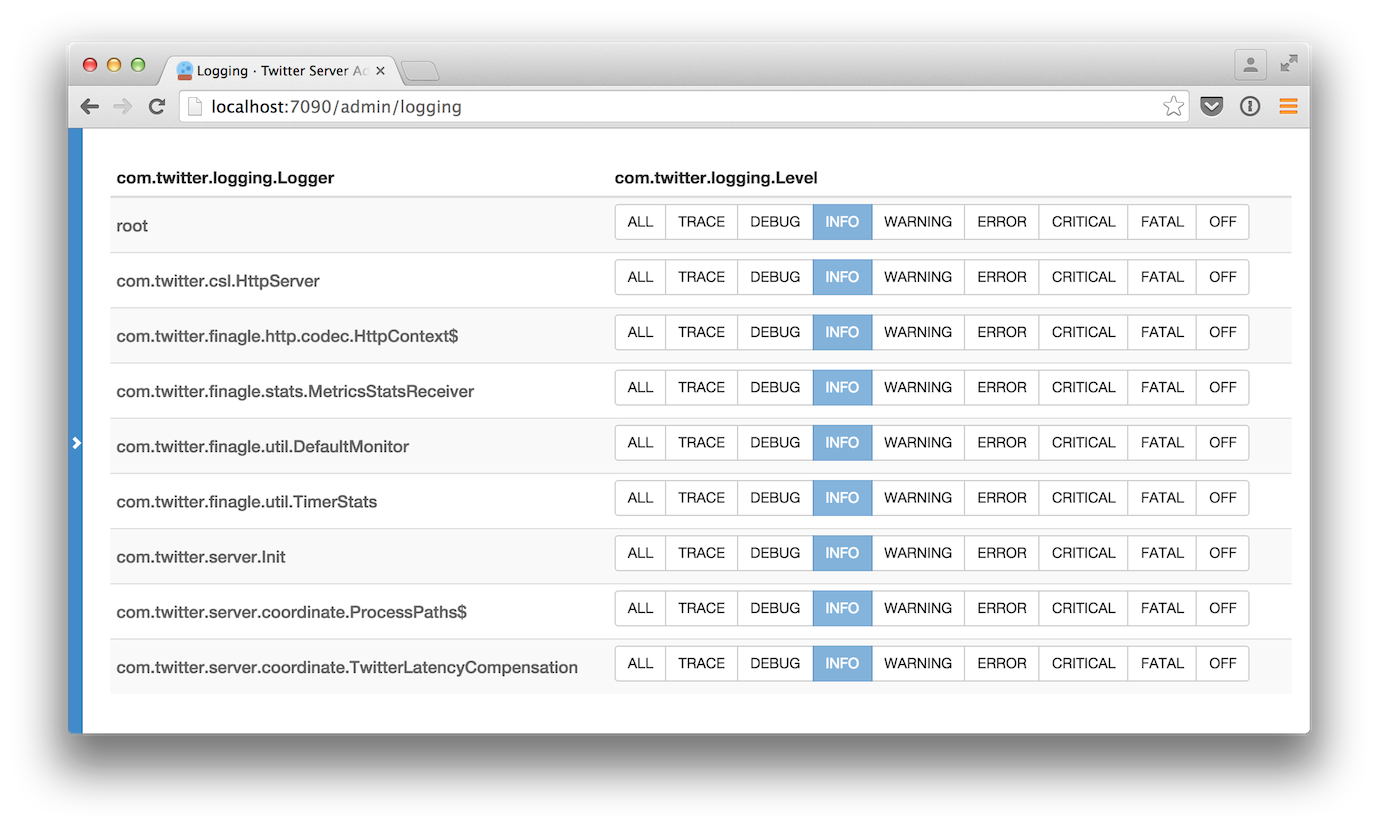
/admin/logging
Display the set of loggers and their current log level. The level of each logger can also be modified on-the-fly.
/admin/toggles
See and modify the server’s in-memory mutable com.twitter.finagle.toggle.Toggles.
GET requests show the current state of all StandardToggleMap StandardToggleMaps. Requests should be of the form /admin/toggles{/$libraryName}{/$id}. Note that the library name and toggle id components are optional and allow for filtering the output on those constraints. The output is JSON and it looks roughly like:
{
  "libraries": [
    {
      "libraryName" : "$libraryName",
      "toggles" : [
        {
          "current" : {
            "id" : "$id",
            "fraction" : $fraction,
            "description" : "$description"
          },
          "components" : [
            {
              "source" : "$ToggleMapSource",
              "fraction" : $fraction
            },
            { <other sources here> }
          ]
        },
        { <other toggles here> }
      ]
    },
    { <other libraries here> }
  ]
}
There will be a hash for each library registered with com.twitter.finagle.toggle.StandardToggleMap. For each Toggle the “current” hash shows the current configuration while the “components” array has a hash per ToggleMap source. These are ordered by evaluation order and as such, sources earlier in a component array are used first.
PUT requests allow for updates/creation of the mutable Toggles while DELETE requests allow for removal. These apply only to the ToggleMap.Mutable ToggleMaps within a StandardToggleMap. Requests must be of the form /admin/toggles/$libraryName/$id. For create and update, and an additional fraction request parameter must be set as well.
/admin/tunables
See and modify the server’s in-memory mutable com.twitter.util.tunable.Tunables.
GET requests to /admin/tunables show the current state of all registered StandardTunableMap StandardTunableMaps. The returned JSON is of the form:
[
  {
    "id" : "$id",
    "tunables" : [
      {
        "id" : "$tunableId",
        "value" : "$value",
        "components" : [
          {
            "source" : "$TunableMapSource",
            "value" : "$value"
          },
          { <other components here> }
        ]
      },
      { <other tunables here> }
    ]
  },
  { <other ids here> }
]
GET requests to /admin/tunables/$id show the current state of the StandardTunableMap registered for $id.
PUT and DELETE requests to /admin/tunables/$id update the in-memory Tunables for $id and should have a JSON body in the same format as a Tunable configuration file, detailed in JsonTunableMapper:
{
  "tunables":
    [
       {
          "id" : "$tunableId",
          "value" : $value,
          "type" : "$class"
       },
       { <other updates here> }
    ]
}
For a PUT request, these Tunables will be updated or added. Note that PUT requests will not cause any existing Tunables to be removed.
For a DELETE request, these Tunables will cleared from the TunableMap. The Tunables are keyed by “id” and “type”; the “value” for each of Tunables to delete can be any valid value for this Tunable. Because the value of a Tunable is the result of a composition of TunableMaps (see StandardTunableMap), deleting an in-memory Tunable will cause the value from the composition of the other TunableMaps to be used.
Metrics
Endpoints regarding your service’s metrics. The Finagle User Guide explains what many of them represent.
/admin/metrics
This metrics endpoint provides the ability to both watch specific metrics in real-time, as well as download data for a specific metric. It is available in TwitterServer regardless of the particular stats library implementation you are using.
Selecting the Watch menu item or navigating to the page directly in your web browser displays all of the reported metrics for this TwitterServer instance. Choosing an individual metric from the list will allow you to watch how its value changes over time.
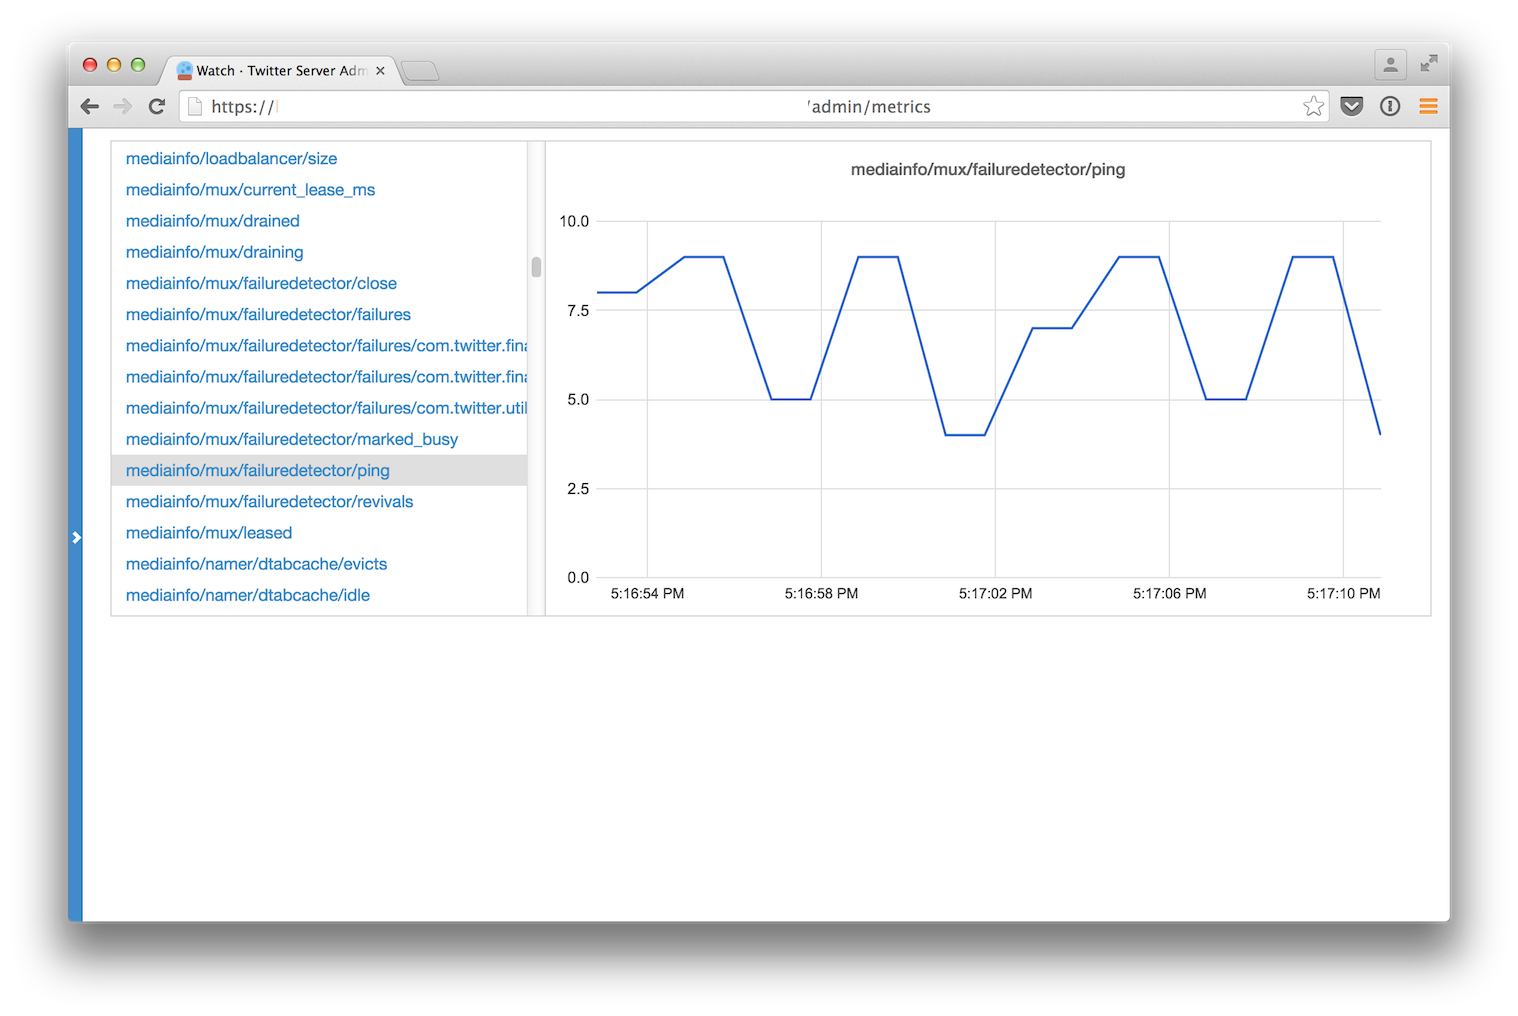
If you know the exact name of the metric that you would like to watch, you can use a fragment (named anchor) within the url to navigate directly to viewing that specific metric.
/admin/metrics#mediainfo/mux/failuredetector/ping
If you would like to download data for an individual metric instead, you may use the m request parameter with the full metric name. The response returned will be JSON and include the name, delta (change since the metric was last sampled), and value (instantaneous value) for the specific metric.
/admin/metrics?m=mediainfo/mux/failuredetector/ping
[
  {
    "name" : "mediainfo/mux/failuredetector/ping",
    "delta" : 3560.0,
    "value" : 41939.0
  }
]
You may specify as many m parameters as you like, one fore each metric you would like to retrieve.
/admin/metrics?m=exceptions&m=jvm/uptime
[
  {
    "name" : "jvm/uptime",
    "delta" : 8.3826464E7,
    "value" : 8.3826464E7
  },
  {
    "name" : "exceptions",
    "delta" : 0.0,
    "value" : 0.0
  }
]
/admin/metrics.json
Export a snapshot of the current statistics of the program. You can use the StatsReceiver in your application for add new counters/gauges/histograms, simply use the statsReceiver variable provided by TwitterServer.
This endpoint is available when you are using the finagle-stats library. See the metrics section for more information.
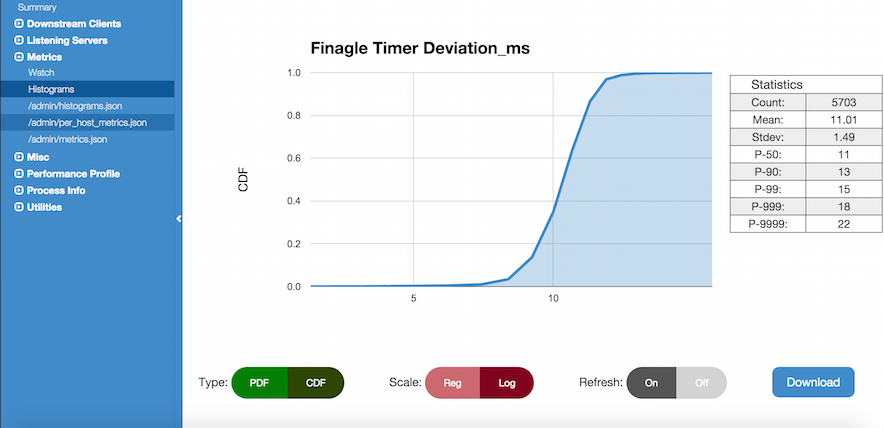
/admin/histograms
Visualize and download histogram-style metrics. The metrics endpoint exposes a summary of the histogram, but it doesn’t expose the full histogram. The full histogram can be useful for seeing the different modes of your metric, which often represent different states of your program.
This endpoint is available when you are using the finagle-stats library. See the metrics section for more information.
For more details, please see the features documentation.
/admin/histograms.json
Export a snapshot of a histogram-style metric in json. This exports the entire histogram, which can be used for correctly aggregating over a cluster, or to efficiently record historic histogram data, or to compare modes in different usages patterns, like times of day. You may add new histograms by adding new stats to your statsReceiver variable.
This endpoint is available when you are using the finagle-stats library. See the metrics section for more information.
/admin/metric_metadata.json
Export metadata information about metrics in json. By default, this exports metadata for every metric. An optional argument name can be added to query for a single metric’s metadata. Multiple names may be passed in using that argument multiple times.
NB: for a histogram, it may be looked up with or without its metrics.json suffix (.sum, .p95, .max, etc).
/admin/metric_metadata.json?name=http/requests&name=strato_rpc_client/latency_ms.p95
{
  "@version" : 3.1,
  "counters_latched" : true,
  "separator_char" : "/",
  "metrics" : [
    {
      "name" : "http/requests",
      "relative_name" : [
        "requests"
      ],
      "kind" : "counter",
      "source" : {
        "class" : "Unspecified",
        "category" : "Server",
        "process_path" : "Unspecified"
      },
      "description" : "No description provided",
      "unit" : "Unspecified",
      "verbosity" : "Verbosity(default)",
      "key_indicator" : false
    },
    {
      "name" : "strato_rpc_client/latency_ms",
      "relative_name" : [
        "latency_ms"
      ],
      "kind" : "histogram",
      "source" : {
        "class" : "Unspecified",
        "category" : "Client",
        "process_path" : "Unspecified"
      },
      "description" : "No description provided",
      "unit" : "Unspecified",
      "verbosity" : "Verbosity(default)",
      "key_indicator" : false,
      "buckets" : {
        "count" : ".count",
        "sum" : ".sum",
        "average" : ".avg",
        "minimum" : ".min",
        "maximum" : ".max",
        "0.5" : ".p50",
        "0.9" : ".p90",
        "0.95" : ".p95",
        "0.99" : ".p99",
        "0.999" : ".p9990",
        "0.9999" : ".p9999"
      }
    }
  ]
}
Top-level/instance-wide Fields:
- @version
the current version of the response document (format: Major.minor).
- counters_latched
a bool indicating whether or not the service is using latched counters.
- separator_char
the character used to separate path fields in a metric name.
- metrics
an array containing Metadata objects for each metric.
Metadata Object Fields:
- name
the fully-qualified name of the metric for this particular Metadata object.
- relative_name
an array containing the field names constituting a suffix which is common across all library users. While the prefix may be configurable, metrics with a shared relative_name can be considered alike.
- kind
a string representing the metric type (counter, gauge or histogram).
- source
an object which describes where the metric comes from (see next section for source-level fields).
- description
text description of the metric intended for human consumption.
- unit
the appropriate unit for this metric (ex, milliseconds, megabytes, count).
- verbosity
the metrics logging verbosity level.
- key_indicator
a bool indicating whether or not this metric is part of this services top-level indicators or golden metrics.
- counterish_gauge
a bool indicating if a gauge represents a count of something over the lifetime of the instance. Note that it does not follow the same latching rules as standard counters. This key will not be present unless it is true. It can only be present on gauge-type metrics.
- buckets
a map from histogram components (percentiles, max, min, sum, etc) to the suffix which completes this metrics name in metrics.json (only present for histograms).
Source Object Fields:
- class
a string containing the name of the scala/java class that generated this metric (not currently populated).
- category
currently either “Server” or “Client” indicating whether the metric pertains to this server or one of its downstreams, but may be expanded in the future. Should be treated as a string.
- process_path
a string indicating the relevant downstream, when there is one.
/admin/metric/expressions.json
Export metadata information about metric expressions in json. These metadata represent commonly used metric queries for the service.
/admin/metric/expressions.json?name=success_rate
{
  "@version" : 0.7,
  "counters_latched" : true,
  "separator_char" : "/",
  "expressions" : [
    {
      "name" : "success_rate",
      "labels" : {
        "process_path" : "Unspecified",
        "service_name" : "thrift",
        "role" : "Client"
      },
      "expression" : "multiply(100.0,divide(rate(clnt/thrift/success),plus(rate(clnt/thrift/success),rate(clnt/thrift/failures))))",
      "bounds" : {
        "kind" : "monotone",
        "operator" : ">",
        "bad_threshold" : 99.5,
        "good_threshold" : 99.97,
        "lower_bound_inclusive" : null,
        "upper_bound_exclusive" : null
      },
      "description" : "The Success Rate",
      "unit" : "Percentage"
    },
  ]
}
Top-level/instance-wide Fields:
- @version
the current version of the response document (format: Major.minor).
- counters_latched
a bool indicating whether or not the service is using latched counters.
- separator_char
the character used to separate path fields in a metric name.
- expressions
an array containing a Metadata object for each metric expression.
Expression Object Fields:
- name
a string representing the name or significance of the expression.
- labels
a dictionary (string -> string) with additional metadata about the metric
- expresssion
a string representation illustrating how to aggregate metrics into the expression value.
- bounds
an object which describes the bounds for what values resulting from the expression should be considered “healthy” for the service.
- description
text description of the expression, intended for human consumption.
- unit
the appropriate unit for this metric (ex, milliseconds, megabytes, count).
Labels Entries:
Although it should be interpreted as a dictionary, not as an object, there are some common fields that are often relevant, especially for Finagle services.
- process_path
a string indicating the relevant downstream, when there is one.
- service_name
a string representing the Finagle service name. particularly helpful for services containing multiple internal servers (ex, thrift and http).
- role
either “Server” or “Client” indicating whether the expression pertains to this server or one of its downstreams. Should be treated as a string.
Bounds Object Fields:
- kind
a string indicating what type of bounds these are: “unbounded” (no bounds), “monotone” (only considered unhealthy in one direction), or “range” (there is a range of healthy values, above or below them is unhealthy).
- operator
a string indicating which whether the bounds should be treated as floors or ceilings (ex, “>”, “<”).
- bad_threshold
the value that represents the boundary between a bad and an ok value for the expression.
- good_threshold
the value that represents the boundary between an ok and a good value for the expression.
- lower_bound_inclusive
an optional value below the bad_threshold which indicates a boundry below which values are considered invalid or erroneous rather than unhealthy.
- upper_bound_exclusive
an optional value above the good_threshold which indicates a boundry above which values are considered invalid or erroneous rather than unhealthy.
Profiling
Endpoints for profiling your process.
/admin/pprof/contention
Returns a CPU contention profile which identifies blocked threads (Thread.State.BLOCKED). The output is in pprof format. The process will be profiled for 10 seconds at a frequency of 100 hz. These values can be controlled via HTTP request parameters seconds and hz respectively.
/admin/contention
Show call stacks of blocked and waiting threads.
$ curl localhost:9990/admin/contention
Blocked:
"util-jvm-timer-1" Id=11 TIMED_WAITING on java.util.concurrent.locks.AbstractQueuedSynchronizer$ConditionObject@33aac3c
  at sun.misc.Unsafe.park(Native Method)
  -  waiting on java.util.concurrent.locks.AbstractQueuedSynchronizer$ConditionObject@33aac3c
  at java.util.concurrent.locks.LockSupport.parkNanos(LockSupport.java:226)
  at java.util.concurrent.locks.AbstractQueuedSynchronizer$ConditionObject.awaitNanos(AbstractQueuedSynchronizer.java:2082)
  at java.util.concurrent.ScheduledThreadPoolExecutor$DelayedWorkQueue.take(ScheduledThreadPoolExecutor.java:1090)
  at java.util.concurrent.ScheduledThreadPoolExecutor$DelayedWorkQueue.take(ScheduledThreadPoolExecutor.java:807)
  at java.util.concurrent.ThreadPoolExecutor.getTask(ThreadPoolExecutor.java:1043)
  at java.util.concurrent.ThreadPoolExecutor.runWorker(ThreadPoolExecutor.java:1103)
  at java.util.concurrent.ThreadPoolExecutor$Worker.run(ThreadPoolExecutor.java:603)
  ...
/admin/pprof/profile
Returns a CPU usage profile. The output is in pprof format. The process will be profiled for 10 seconds at a frequency of 100 hz. These values can be controlled via HTTP request parameters seconds and hz respectively.
$ curl -s localhost:9990/admin/pprof/profile > /tmp/cpu_profiling
$ pprof --text /tmp/cpu_profiling
Using local file /tmp/cpu_profiling.
Using local file /tmp/cpu_profiling.
Total: 83 samples
      17  20.5%  20.5%       24  28.9% com.twitter.finagle.ProxyServiceFactory$class.status
       8   9.6%  30.1%       10  12.0% scala.collection.immutable.HashMap$HashTrieMap.updated0
       5   6.0%  36.1%       70  84.3% scala.collection.Iterator$class.foreach
       5   6.0%  42.2%        5   6.0% scala.runtime.ScalaRunTime$.hash
       4   4.8%  47.0%        4   4.8% com.twitter.finagle.transport.Transport$$anon$2.status
       4   4.8%  51.8%        4   4.8% sun.management.OperatingSystemImpl.getOpenFileDescriptorCount
       3   3.6%  55.4%        9  10.8% com.twitter.finagle.Filter$$anon$2.status
       ...
/admin/pprof/heap
Returns a heap profile computed by the heapster agent. The output is in pprof format.
$ java -agentlib:heapster -jar target/myserver-1.0.0-SNAPSHOT.jar
$ pprof /tmp/heapster_profile
Welcome to pprof!  For help, type 'help'.
(pprof) top
Total: 2001520 samples
 2000024  99.9%  99.9%  2000048  99.9% LTest;main
    1056   0.1% 100.0%     1056   0.1% Ljava/lang/Object;
     296   0.0% 100.0%      296   0.0% Ljava/lang/String;toCharArray
     104   0.0% 100.0%      136   0.0% Ljava/lang/Shutdown;
Downstream Clients
The Finagle clients that your service depends on.
/admin/clients
Surface client information exposed by Finagle. Per-client configuration parameters and values for each module are available at /admin/clients/<client name>.
Listening Servers
The Finagle servers that your service is running.
/admin/servers
Surface server information exposed by Finagle. Per-server configuration parameters and values for each module are available at /admin/servers/<server name>.
/admin/servers/connections
Expose information about currently connected clients including encryption status, if available.